Enable Debugging in WordPress
Need to troubleshoot issues on your WordPress site? Whether you’re facing plugin errors, theme issues, or unknown bugs, enabling debugging can help you get to the root cause fast.
WordPress has a built-in debug mode that logs all PHP errors, warnings, and notices. It’s an essential step for any developer or site owner trying to fix problems or fine-tune site performance.

Enable Debugging in WordPress (Step-by-Step)
1) Locate the wp-config.php File
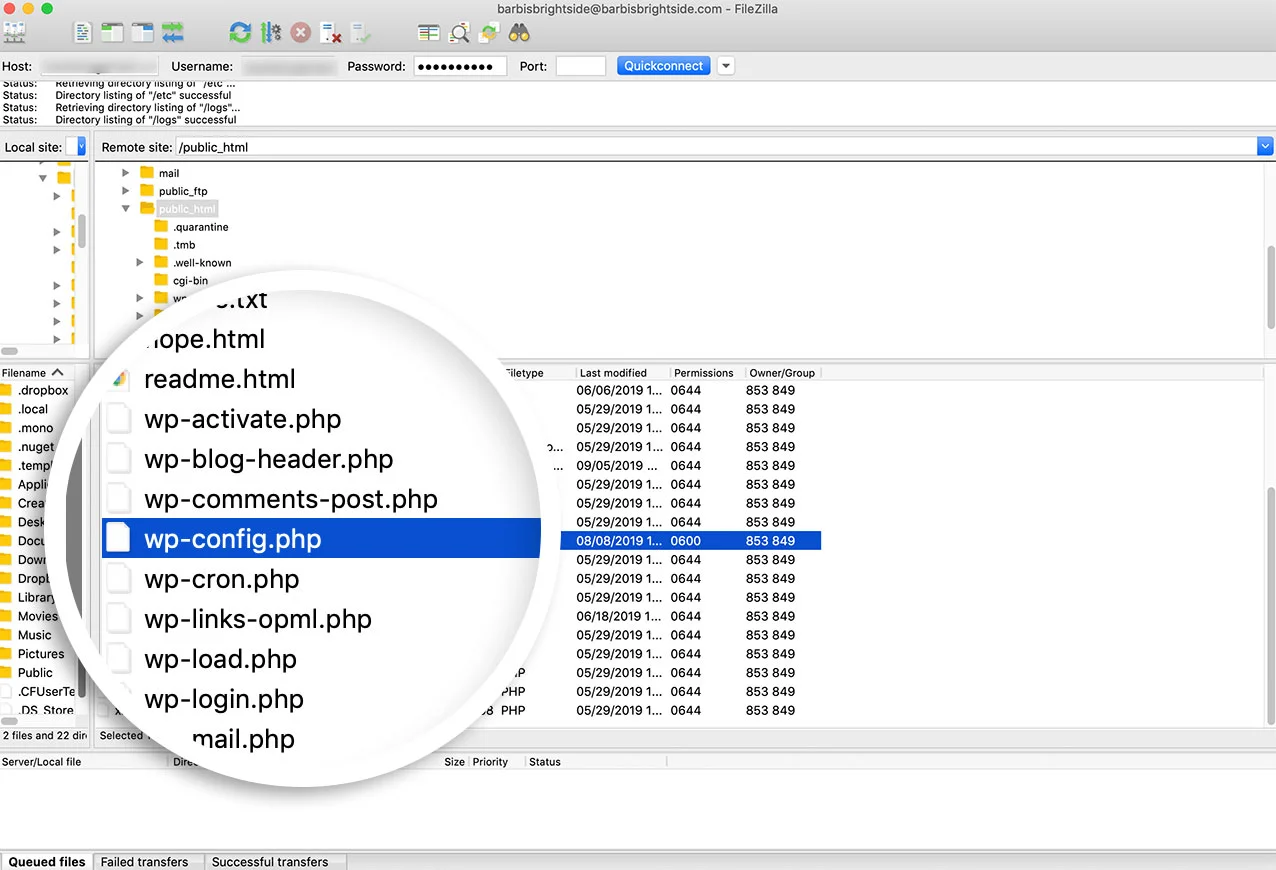
To begin, you’ll need access to your site’s files. You can do this using:
- An FTP client like FileZilla
- The cPanel File Manager (if your host provides it)
- Or install a plugin like WP File Manager for direct access inside your dashboard.
The file you’re looking for—wp-config.php—is located in your site’s root folder.
2) Open and Edit the wp-config.php File
Now, scroll through the file and look for this line:
define( 'WP_DEBUG', false );
This line may already be present, or you might need to add it manually.
3) Add the Debugging Code
Replace the above line (or add just before the line that says /* That's all, stop editing! Happy blogging. */) with the following block:
// Enable WP_DEBUG mode
define( 'WP_DEBUG', true );

// Enable Debug logging to the /wp-content/debug.log file
define( 'WP_DEBUG_LOG', true );

// Disable display of errors and warnings on the frontend
define( 'WP_DEBUG_DISPLAY', false );
@ini_set( 'display_errors', 0 );

// Use development versions of core JS and CSS files
define( 'SCRIPT_DEBUG', true );

This setup will log all errors to a file inside /wp-content/debug.log without displaying them to your website visitors — keeping things clean and secure.
4) Replicate the Issue
Now go back to your site and do whatever was causing the error earlier — whether it was loading a plugin, submitting a form, or just visiting a certain page.
This forces the system to log the error into your new debug log.
5) View the Debug Log
Go to: /wp-content/debug.log
You can view it using FTP, cPanel, or your file manager plugin.
PHP Notice: Undefined variable: value in /wp-content/themes/mytheme/functions.php on line 90
This log tells you exactly which file and line number caused the problem — super helpful for resolving bugs.
✅ Common Debug Log Errors (and What They Mean)
| Error Type | Description |
|---|---|
Undefined index |
You’re trying to access an array key that doesn’t exist. |
Call to undefined function |
The function being used hasn’t been declared or loaded yet. |
Headers already sent |
Output started before headers (likely whitespace or echo above header()). |
Cannot redeclare function |
The same function is defined more than once (duplicate includes). |
Fatal error: memory exhausted |
Your site ran out of allocated PHP memory. Increase the limit in wp-config.php. |
6) Protect Your Debug Log from Public Access
The debug log can reveal sensitive info. To protect it, you can add this snippet in your /wp-content/.htaccess file:
<Files debug.log>
Order allow,deny
Deny from all
</Files>
Alternatively, plugins like Wordfence or iThemes Security can help you secure debug files automatically.
7) Turn Off Debugging After Use
Once you’ve fixed the issue, remember to disable debugging. Open wp-config.php again and update the code like this:
define( 'WP_DEBUG', false );
define( 'WP_DEBUG_LOG', false );
define( 'WP_DEBUG_DISPLAY', false );
Resources & Further Reading
Last Updated
This guide was updated on July 19, 2025 to reflect the latest WordPress practices and error handling techniques.
Share This Story, Choose Your Platform!
 WPForms to Google Sheets Hits 8,000+ Active Installs - A Milestone!
 10 Essential Google Sheets Features for Beginners (Master the Basics)